






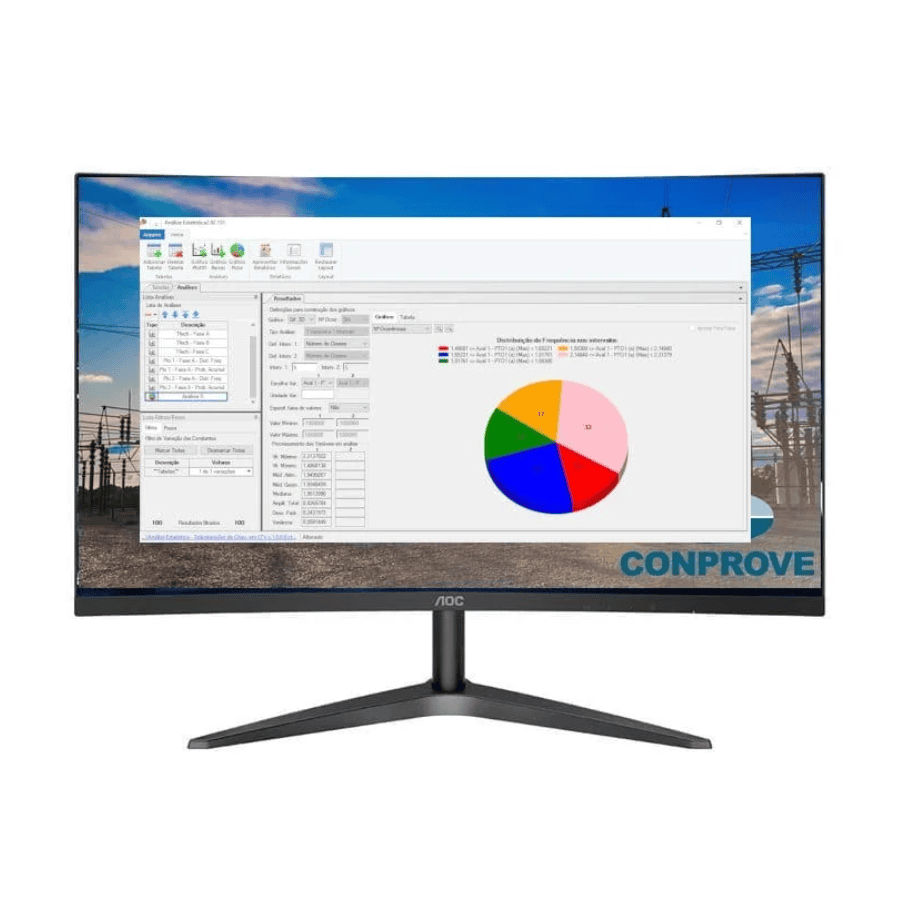
Description
This software is capable of performing the statistical analysis of a set of data (stored in files with .CSV format (comma separated values)) allowing the visualization of the results obtained, through graphs of the types: XY, bar or pie. The software allows quick and easy visualization of parameters such as: maximum values, minimum values, arithmetic means, geometric means, medians, standard deviations and variances of a group of data.
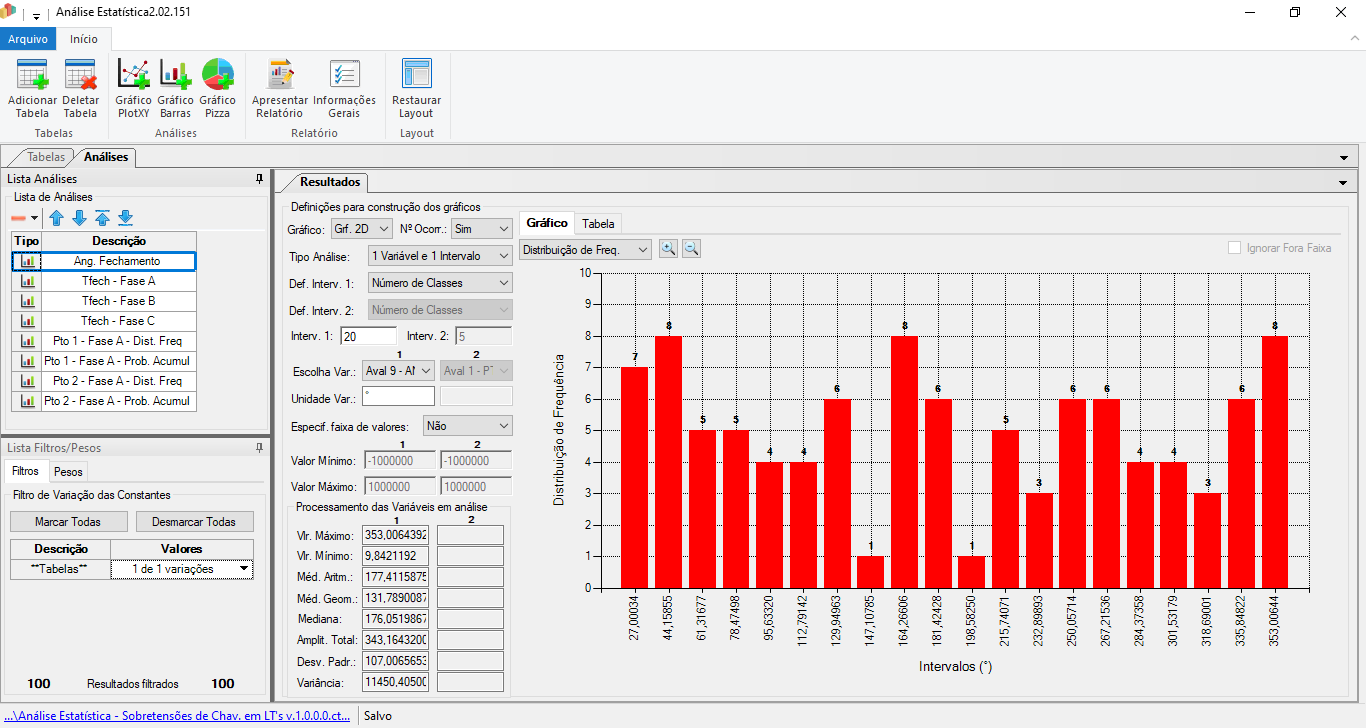
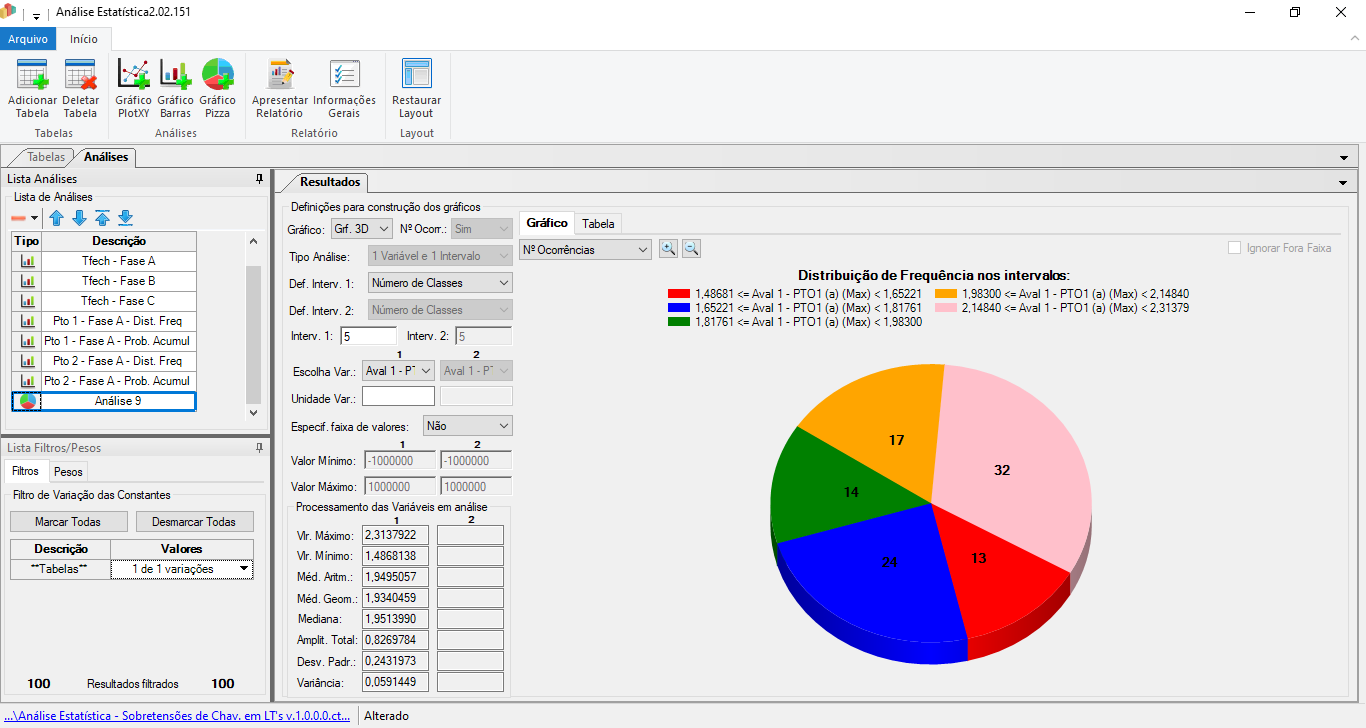
In addition to generating basic statistics, Software Statistical Analysis provides a comprehensive environment for importing, organizing, and interpreting large volumes of experimental data. The software allows users to import multiple CSV files, organize information into independent tables, and classify each column as a constant, variable, or disregarded field, offering greater flexibility during data processing.
To ensure more precise analysis, users can apply filters and weights to imported data, selecting only desired datasets or assigning different relevance levels to results. These features enable customized statistical studies and fast, intuitive comparisons across different scenarios, making it easier to evaluate the performance of equipment under test.
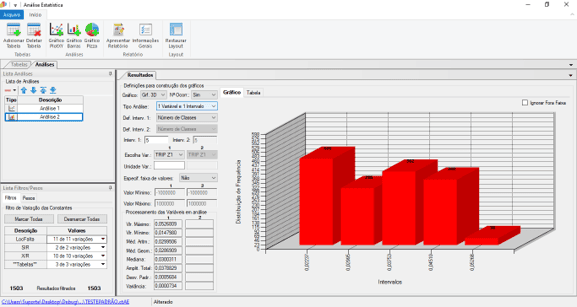
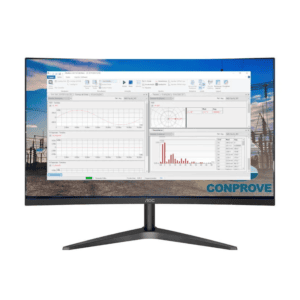
Software Statistical Analysis offers various result visualization options, including XY charts, bar graphs, and pie charts, while automatically displaying statistical indicators such as maximum and minimum values, arithmetic and geometric means, median, standard deviation, and variance. Charts can be customized to suit analysis requirements, providing a clear and straightforward view of data behavior.
Another key advantage is its ability to automatically process imported information, including label-defined variables, missing values, and varying sample sizes. The software also enables the generation of comprehensive reports containing charts, tables, calculated statistics, and general analysis information, making it an efficient tool for technical documentation, result validation, and statistical studies applied to tests performed with CONPROVE equipment.
Equipped with features tailored for result organization, processing, and presentation, Software Statistical Analysis simplifies large dataset analysis, increasing user productivity and delivering greater reliability in interpreting data obtained during tests, simulations, and power system studies.













Reviews
There are no reviews yet.